Working with colors on floor plans
One of the core usage for Smplrspace is data visualization. As such, good utilization of color theory is an advantage to create a great user experience. With the Color class, we wrap the knowledge we collected through years of building visualizations to help you get going quickly.
A little context
A fundamental in our approach, not with visualization at large, but specifically with visualization on a floor plan, is that you're doing spatial data visualization. This opens the door to bringing in knowledge from the well researched areas of cartography and geospatial data visualization. One of the most respected names in the industry is Dr. Cynthia Brewer, American cartographer, who studied the psychological perception of colors used in infographics on maps, and more specifically on choropleth maps. Her online tool, ColorBrewer is where we extracted the great majority of the color scales we suggest here.
Another aspect of color utilization with Smplrspace, is that you're manipulating colors in Javascript. Having at hand tools that let you programmatically manipulate colors easily, and in a way that is aligned with common data visualization patterns, is a strong advantage. We highly recommend using chroma.js by Gregor Aisch (homepage), a former graphics editor at The New York Times (work) and co-founder of Datawrapper, an online tool to create charts, maps, and tables. Chroma.js is the underlying color utility used in the Smplrspace codebase and our color scales come loaded with options powered directly by the library.
Color tools we provide
Scales and legend
The Color class in smplr.js provides a few color tools to help you get going quickly. The main part is color scales. We provide numerical scales based of ColorBrewer, including sequential single hue, sequential multi-hue, and diverging scales. We also provide a categorical scale that helps you quickly map categories to colors, and a RAG (red/amber/green) scale.
We also have a Legend component suitable for numerical scale, which works with our scales and your custom scales as well. This component is available for React, as well as vanilla Javascript.
Color mapping
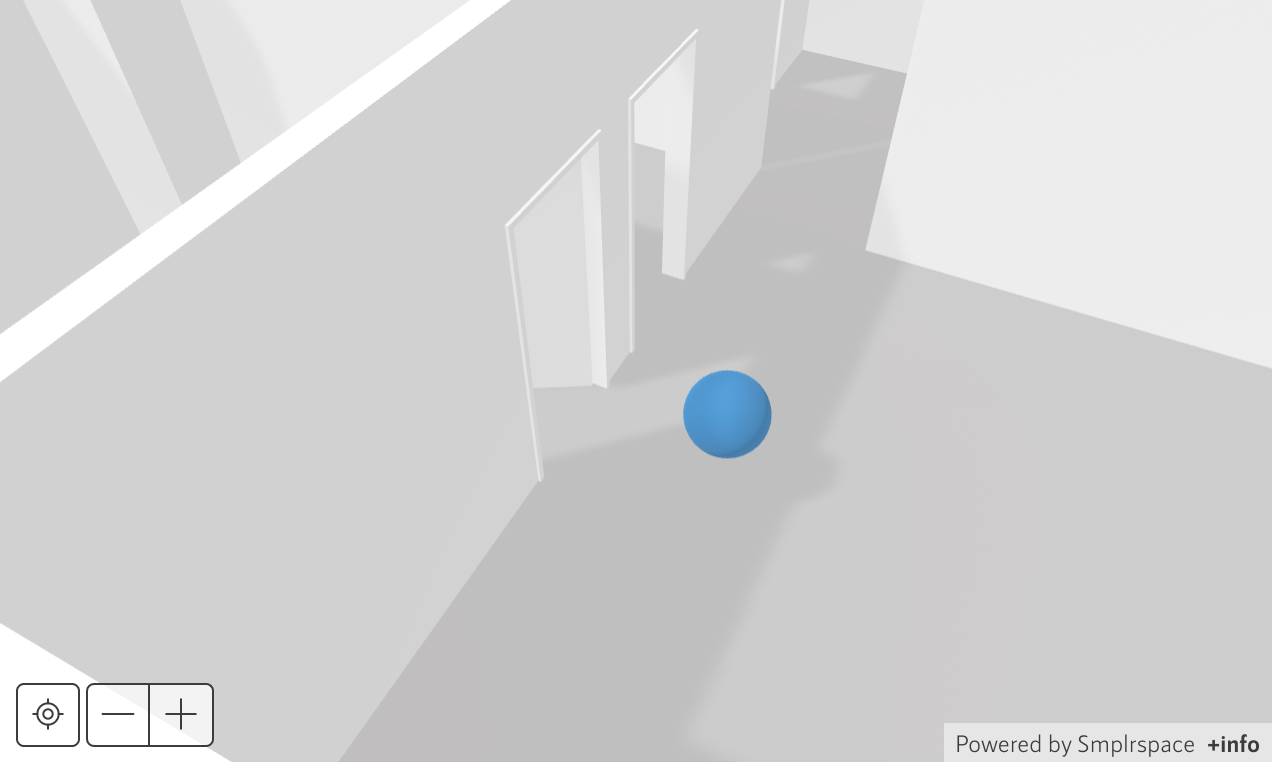
Finally, as the Smplrspace viewer is a 3D scene, colors are affected by a number of parameters like lighting, materials, shadows, etc. So colors in the viewer do not behave like clean CSS colors. You can actually see how a single sphere does not have the same color on its whole surface.
To make colors more predictable, we provide two utility methods to convert colors between their CSS value and their approximate perceived value in the viewer. As explained, their is no clear one to one mapping, but we generally found that this works quite well. You could for example use this to render a custom legend for categorical scales.
Next pages
Explore these tools on their respective API reference pages: